Exploratory Analysis - New York MTA subway data
In this project I used publicly available MTA subway turnstile data, as well as city data, to recommend the best way to deploy recruitment / promotion teams to target diversity / demographics.
Initial Assumptions
- For total turnstile traffic, we considered a sum of entries and exits.
- We assumed the gala is being held early in June; thus we used subway data for the 4 weeks of May, 2016.
- We decided to focus the target demographic on women working in the tech industry.
- We further assumed the target demographic will use subway stations near their place of residence; we were not considering major commuter stations as commuters would probably be less likely to attend a gala in the city.
Demographics Data
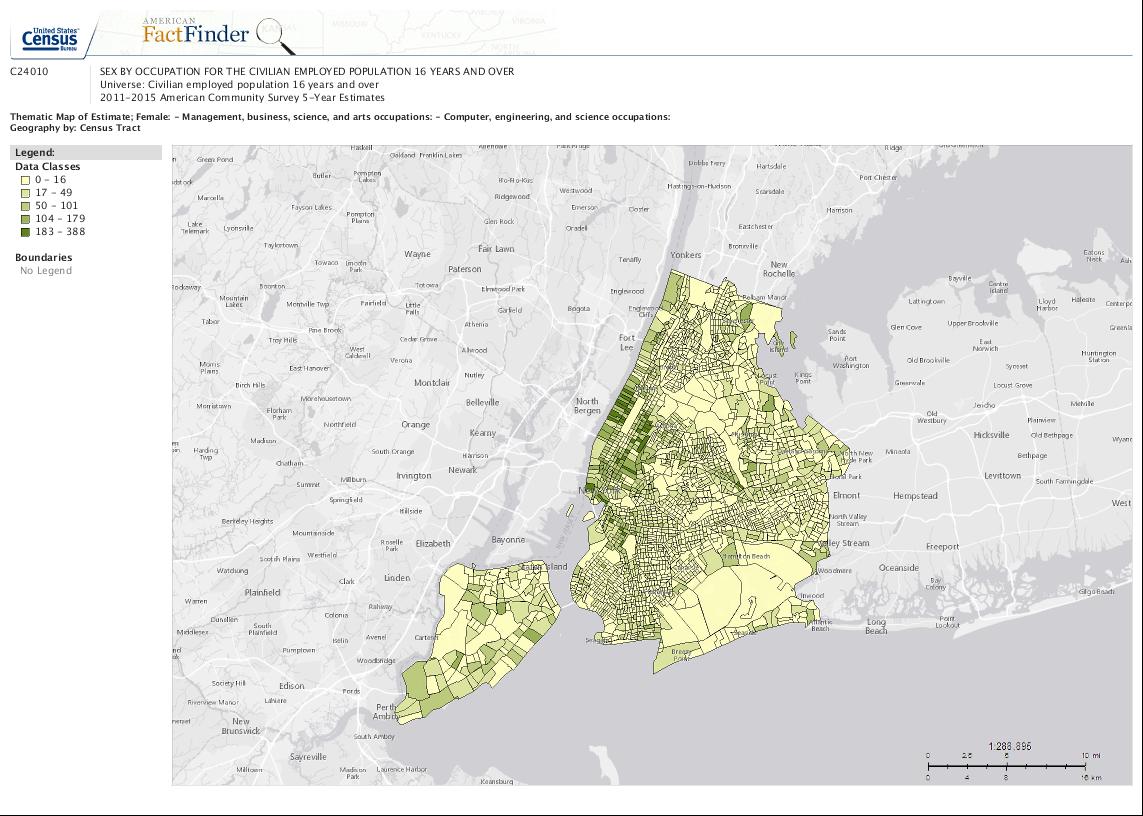
To locate areas with a high density of women residents who work in tech industries, we used public data from the American Community Survey at Census.gov.

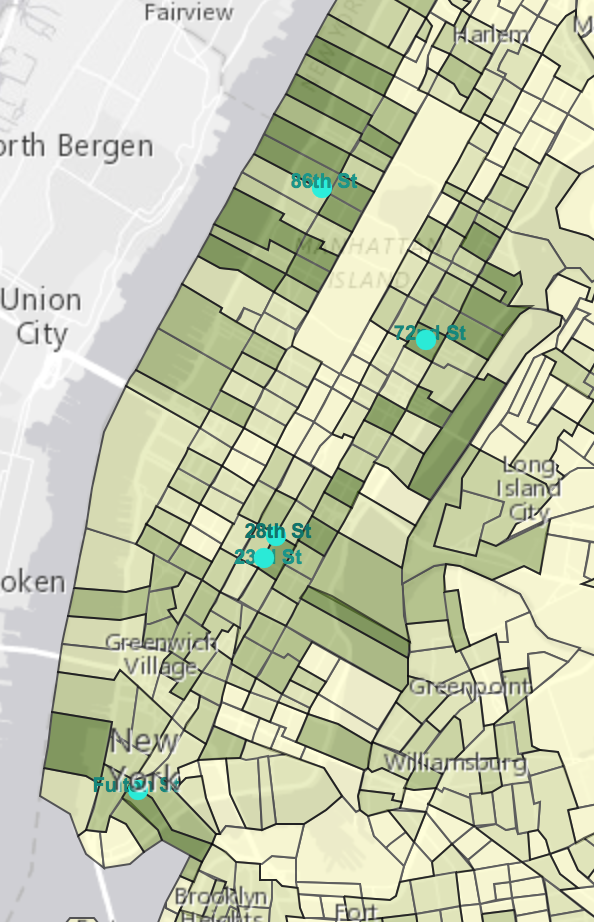
For a detailed view of population density we used data count by Census tract, a small subdivision used for Census data, for each of the 5 boroughs/counties of New York City. The Census website has the ability to create a “heatmap” using the requested data:
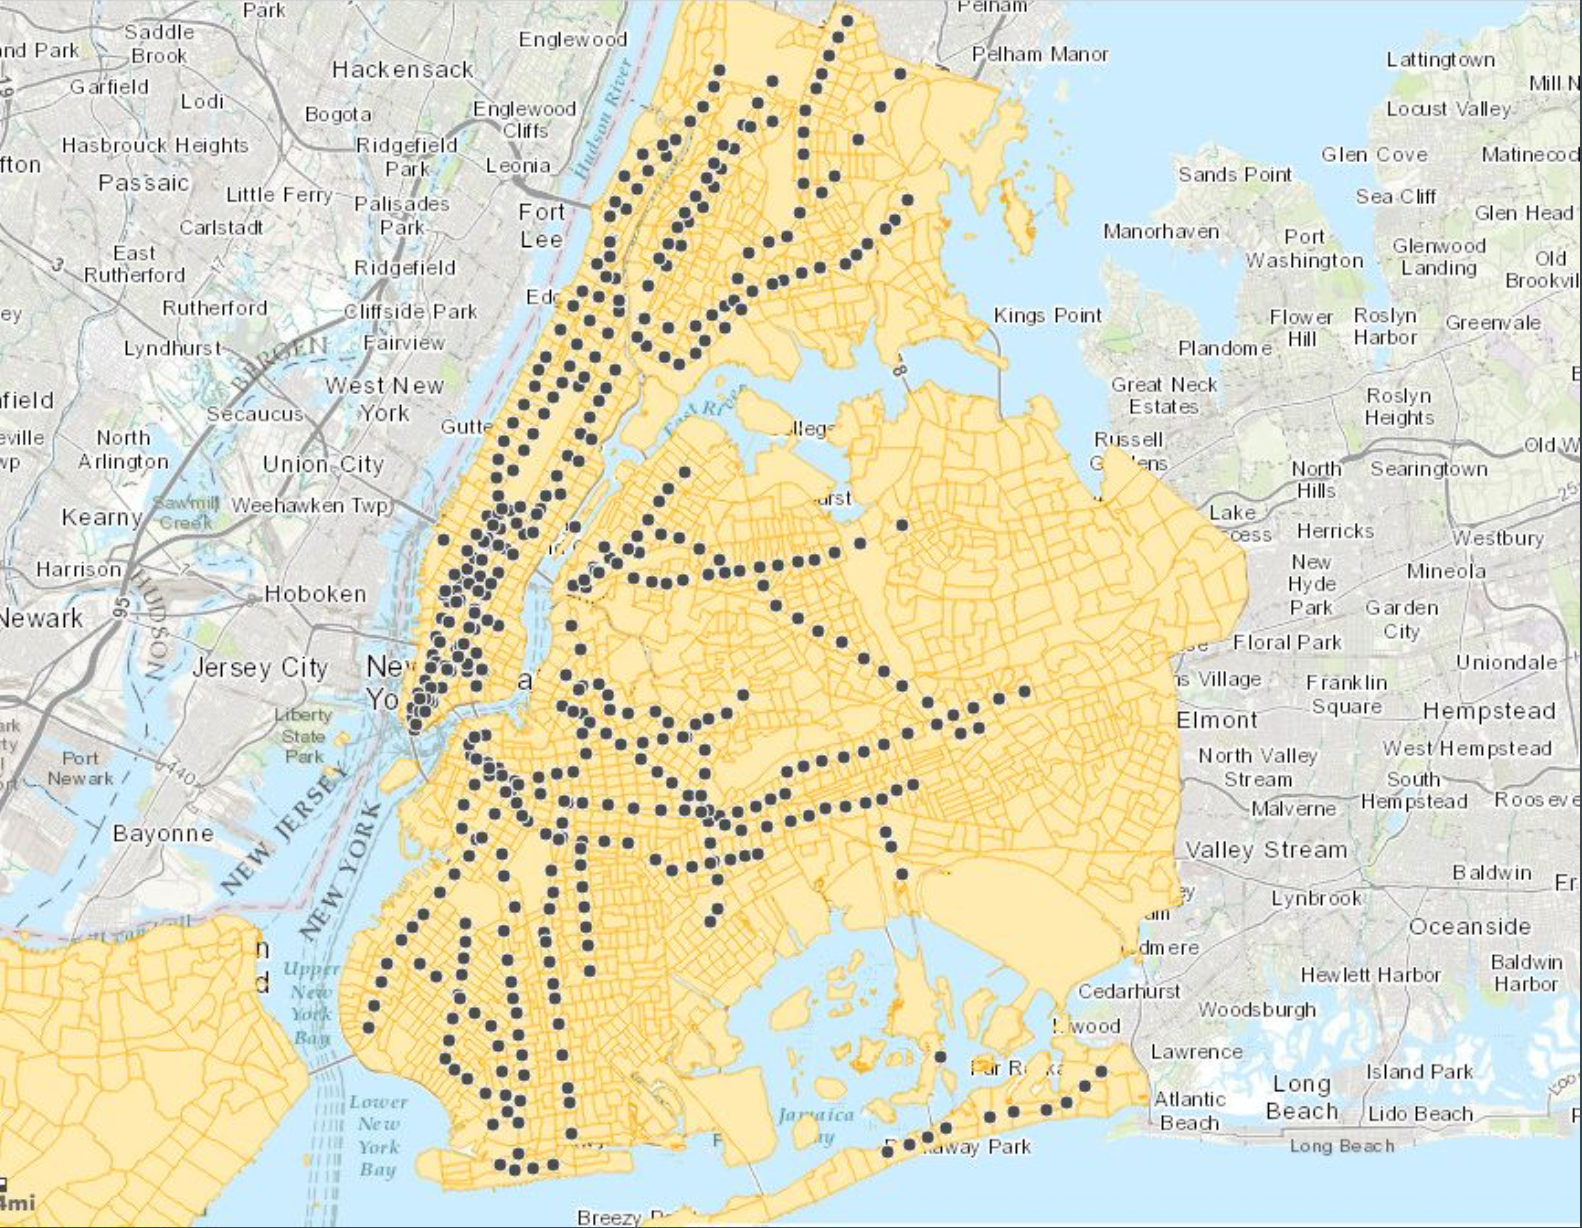
We joined the population data to a list of subway stations, using their corresponding Census tract location from data on ArcGIS.
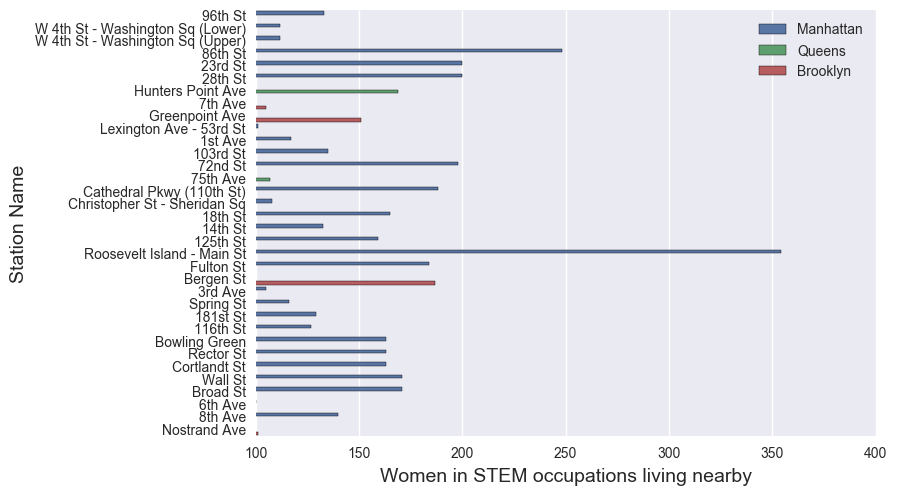
Here is the list of stations with resident count for women in tech occupations > 100.
Station Traffic Data
Finding the cumulative station traffic for the month required joining the four weeks of MTA turnstile data and aggregating multiple turnstile machines for each station. In order to deal with turnstile counters with mismatched values or counter resets, we added T/F flags to the datasets at machine/counter changes. After aggregation, we still had some negative values and unexpectedly large values due to further counter value errors. We ignored these values by choosing station counts between 0 and 6,000 per 4-hour timeblock.
Identifying Locations to Focus Flyering / Promotion Efforts
Top Stations by Female Residents in Tech
- Roosevelt Island - Main St
- 86th St
- 72nd St
- 28th St
- 23rd St
Top Stations by Traffic Volume in May
- 34th St - Penn Station
- Grand Central - 42nd St
- 34th St - Herald Sq
- 23rd St
- 86th St
Creating a combined ranking of the top 50 stations on both lists yielded the following:
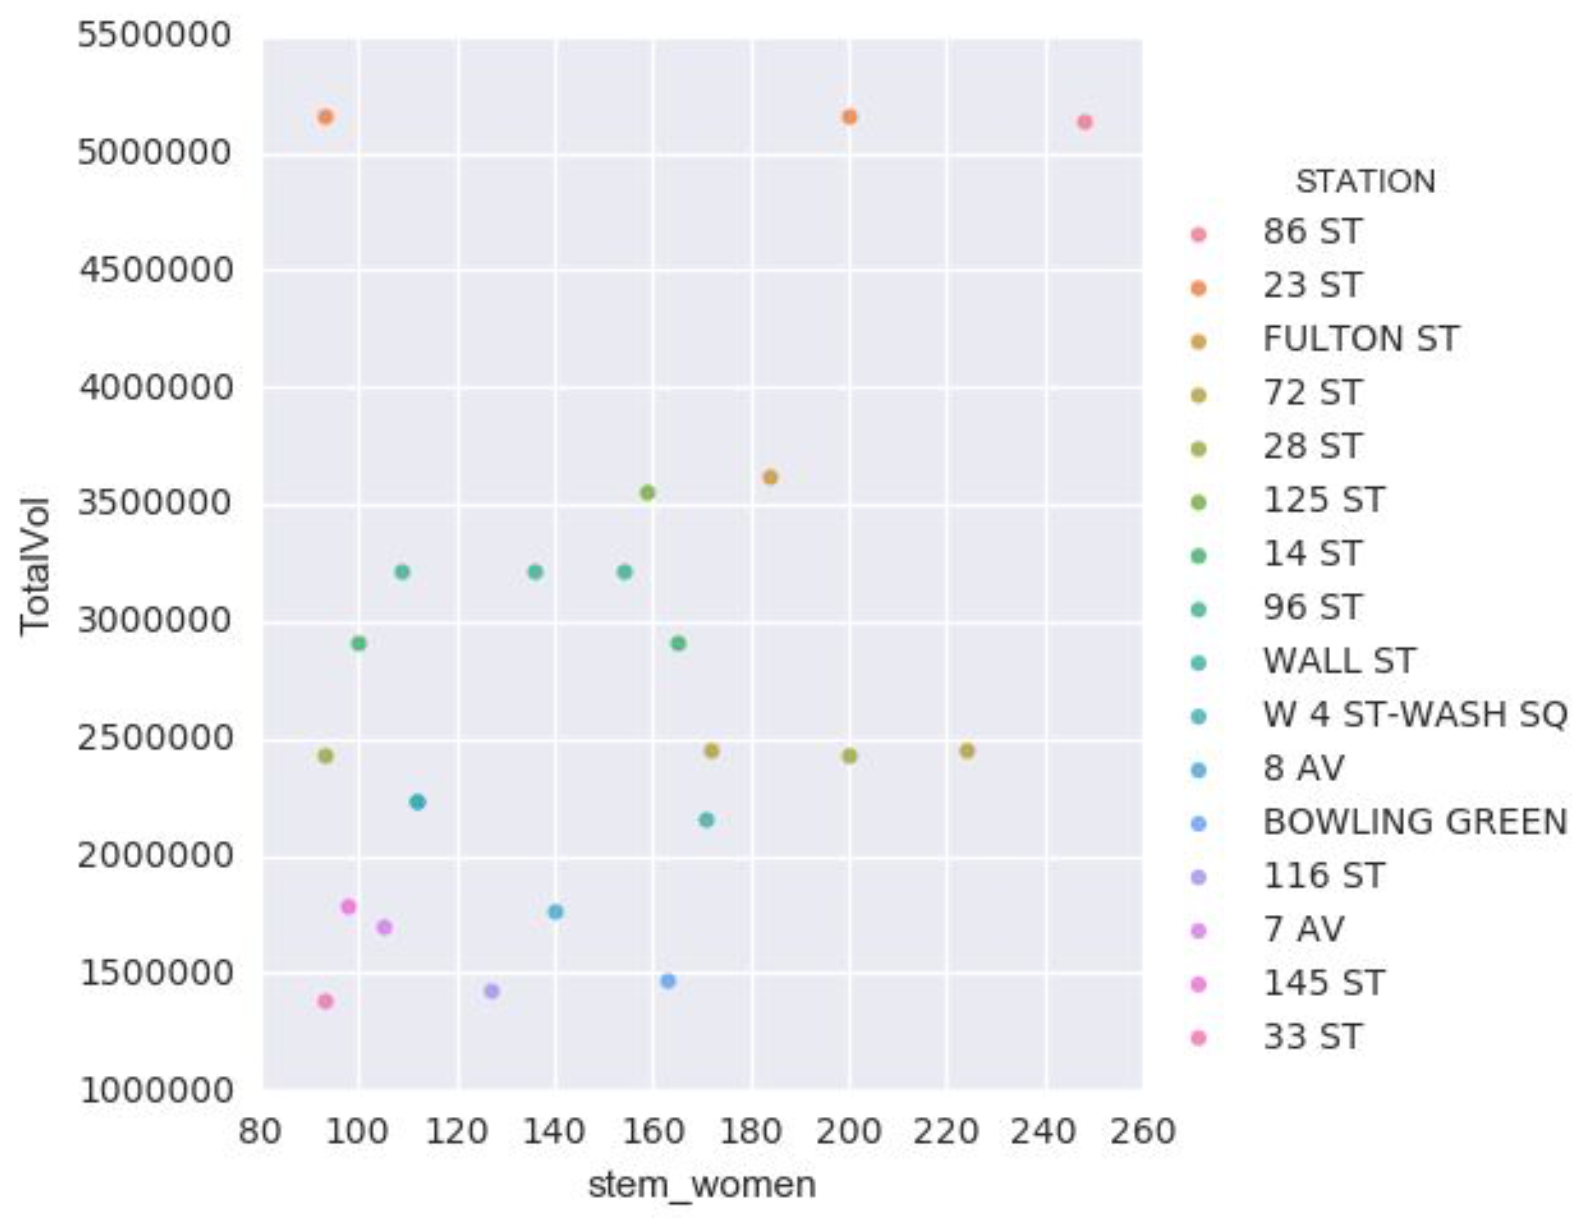
Overall Ranking: Best Stations for Promotion
- 86th St
- 23rd St
- Fulton St
- 72nd St
- 28th St
Outlier
It’s worth noting that Roosevelt Island, located in the East River across from Manhattan’s Lenox Hill and Midtown East neighborhoods, registered by far the most women residents in computer/engineering/science occupations, at 354. So even though the Roosevelt Island MTA station is not a high traffic stop, it may be worth sending recruitment teams to this area. Upon further reading we learned that this residential neighborhood, close to Manhattan but quieter and cheaper, is actually the location of a major tech initiative - the Cornell Tech campus, opening in summer 2017. Clearly this area will only be increasing in importance for the New York tech scene in coming months.
Further Considerations
Further time could be spent on more in-depth data cleaning, particularly with the MTA turnstile data. We used count cutoff values as a straightforward way to ignore spurious values. It could also be valuable to do a more detailed station traffic analysis using time of day or day of week.
For more step-by-step details of the project, see my iPython Notebook.